Logistic Regression Classification conception for machine learning
Pre-knowledge
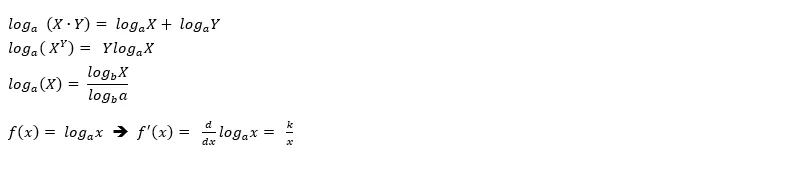
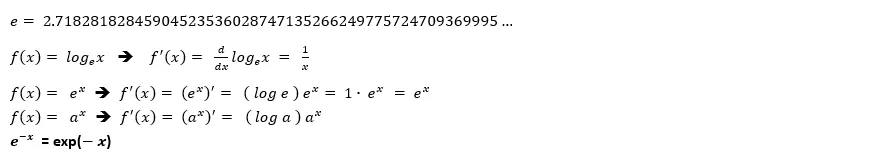
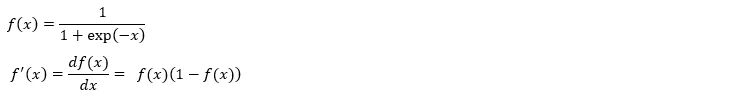
3. Sigmoid

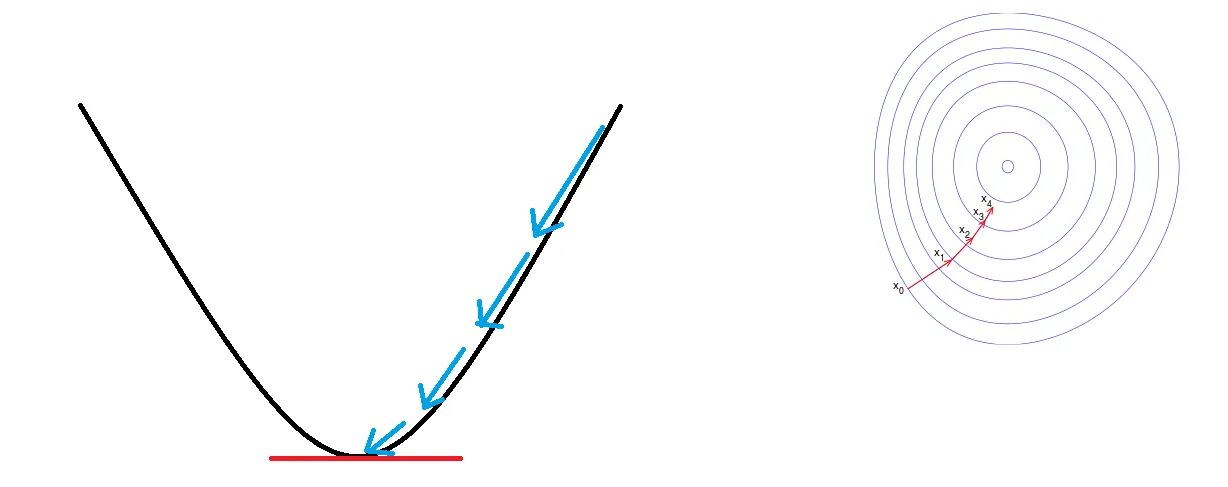
more referance : https://en.wikipedia.org/wiki/Gradient_descent
Logistic Regression Classification
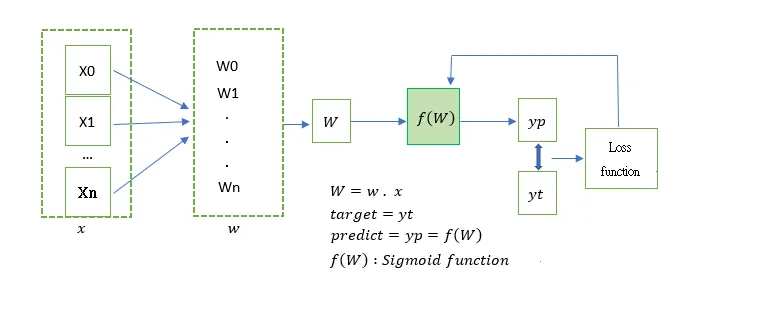
The focus of the gradient descent method is to establish a differentiable loss function, and finally find out the parameters that minimize the loss function step by step, so that a prediction function can be generated for prediction.
But if it is applied to classification problems (whether it is improved, whether it is safe, whether it is available, etc.), the predicted value alone is not enough to distinguish which category it is.
(1) It is expected that the size of the predicted value can range from negative infinity to positive infinity, and classification cannot be achieved. We want the expected classification to be either 0 or 1.
That is, target is either 0 or 1.
(2) Can we think of a way to shrink the value between 0 and 1
(3) from(1)、(2),Sigmoid function can do
A value converted to a value between 0 and 1 can also be regarded as a representative probability! A probability close to 0 or close to 1!
Loss Function (Cross entropy)
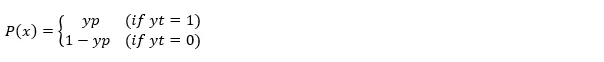
Model prediction stage behavior representation:

yt will only be one of 0 or 1. If the probability of yt=1 is yp, the probability of yt=0 is 1-yp. The probability can be expressed as follows:
And multiply the P of all the input data together to get the likelihood function Lk ,

the likelihood function is the total probability, from the above description of the probability, the bigger the better!
Slightly explain the composition of the likelihood function。
Refer to the examle paragraph of https://en.wikipedia.org/wiki/Likelihood_function ,We can draw a conclusion:
For the same likelihood function, in the model it represents, there are many possibilities for a certain parameter value, but if there is a parameter value that maximizes the value of the likelihood function, then this value is the most “reasonable” parameter parameter value.
For Example,Assuming 10 data, it is determined that 4 are category 1 (probability is yp), and the other 6 are category 0 (probability is 1-yp), so the likelihood function described in the example is

Assuming m data, it is determined that n data are classified as 1 (probability is yp), and the other m-n data are classified as 0 (probability is 1-yp), so the likelihood function described in the example is

Return to the likelihood function Lk,Logarithm on both sides:

Next, define the loss function: the larger the likelihood function, the better, but the smaller the loss function, the better, so likelihood function multiply it by a negative value; the loss function value will increase proportionally with the number of data items, so take the average to make it Not affected by the number of files.
The greater the probability, the greater the accuracy rate, the greater the probability, the higher the accuracy rate, and in the case of the maximum probability obtained, the corresponding obtained W vector is:
(1) Maximize the likelihood function of multiplying P for all data
(2) Maximize the probability of the identified result
(3) Minimize the error (loss function result is the smallest)
So the Loss Function is:

Combined with the gradient descent method to differentiate each w, we can get

logistic regression (k represents the number of iterations ):
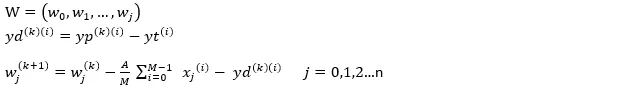
A is hyperparameters
Referance:
- https://rasbt.github.io/mlxtend/user_guide/classifier/LogisticRegression
- https://msu-cmse-courses.github.io/cmse202-S23-jb/daily/Day-15/Day-15_In-Class_ML-LogisticRegression-STUDENT.html
- https://rasbt.github.io/mlxtend/user_guide/classifier/SoftmaxRegression
- https://en.wikipedia.org/wiki/Logistic_regression